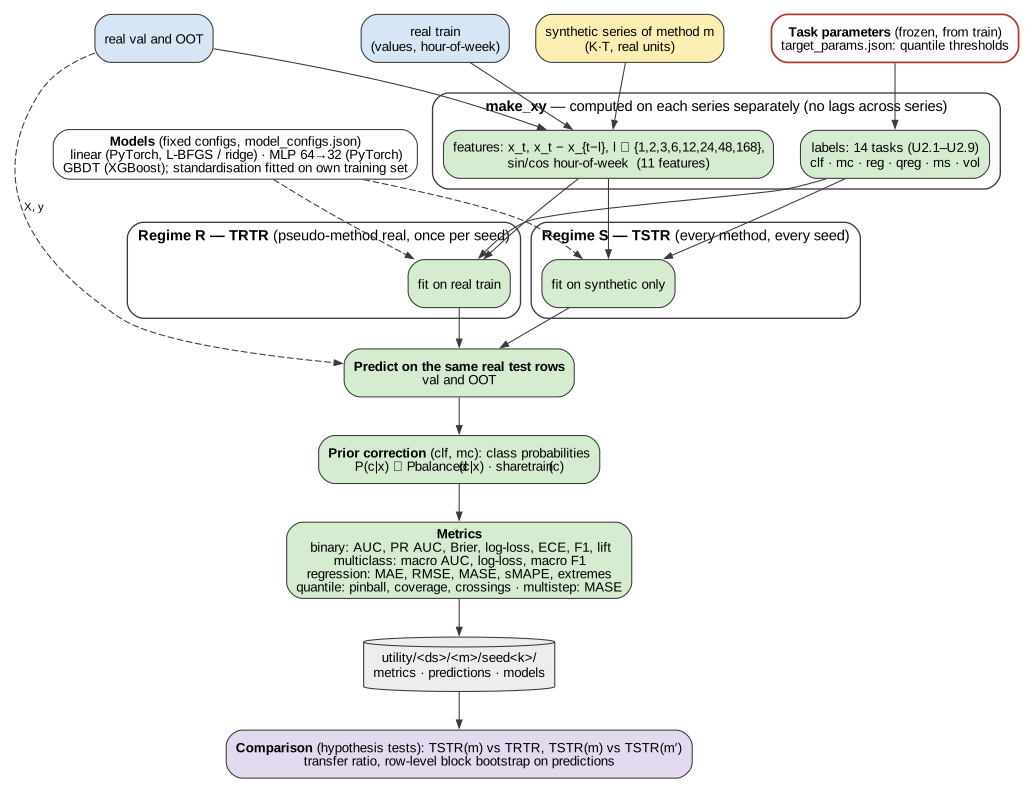
Figure 10 — Utility pipeline (TSTR vs TRTR)
File: fig10_utility_pipeline.pdf
Suggested caption. Utility protocol. Features and labels are computed separately on each series: real train, the synthetic series, and the real test parts. Thresholds are frozen on real train. Each model is trained either on real train (TRTR) or on the synthetic series only (TSTR) and evaluated on the same real val and OOT rows. Synthetic data never enters a test set.
Steps
- Inputs. Real train; the synthetic series of method m (K·T points, real units); real val and OOT.
- Task parameters. Quantile thresholds per (dataset, task), fixed on real train and read from
target_params.json. make_xyon each series separately (no lags across the boundary between series): 11 features (value; differences at lags 1, 2, 3, 6, 12, 24, 48, 168; sin/cos of hour of week) and labels for 14 tasks (Fig. 11).- Training regimes. R = TRTR (pseudo-method
real, once per seed) and S = TSTR (every method, every seed). Models:linear,mlp(PyTorch) andgbdt(XGBoost), with fixed configurations frommarathonts/bench/model_configs.json. Each model standardises features on its own training set. - Prediction on the same real test rows (val and OOT).
- Prior correction (classification only). Classifiers are trained with balanced class weights. Their probabilities are mapped back to the class shares of their own training set, P(c|x) ∝ P_bal(c|x) · share_train(c), so Brier, log-loss and ECE measure calibration. AUC, PR AUC, lift and F1 are unchanged.
- Metrics (registry
utility_metrics): binary: AUC, PR AUC, Brier, log-loss, ECE, F1, lift; multiclass: macro AUC, log-loss, macro F1; regression: MAE, RMSE, MASE (seasonal naive scale, lag 168), sMAPE, error on extremes; quantile: pinball, coverage, crossing rate; multistep: MASE over the horizon and at the last step. - Outputs. Metrics, every prediction and the weights of every model, per (dataset, method, seed). The statistics compare TSTR(m) with TRTR (transfer ratio, RQ1, RQ4, RQ5) and with TSTR of other methods (RQ1–RQ3, RQ8–RQ9). Row-level block bootstrap tests use the saved predictions.
Notes for the text
- The benchmark measures the quality of synthetic data, not its value as augmentation. Real + synthetic regimes are not included.
- Optional, profile
maxonly: hyperparameter search on the last 20% of real train (gap h + 168 rows), and the RQ5 (c) grid (11 model configurations, ranking agreement and threshold transfer).