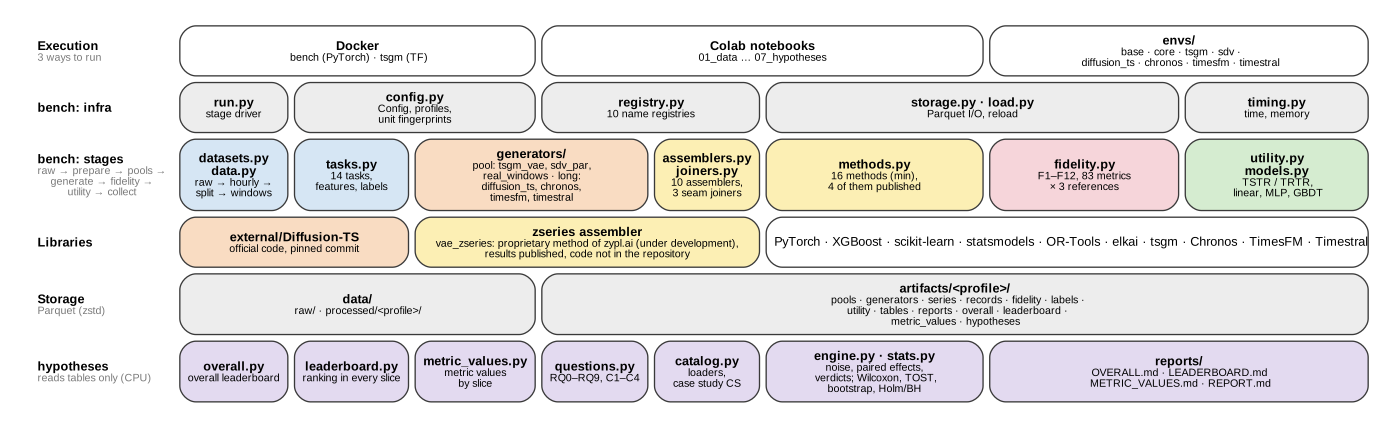
Figure 1 — Software architecture
File: fig01_architecture.pdf
Suggested caption. Layered architecture of the benchmark. The bench package runs the
pipeline stages and finds every component by name in a registry. The official
Diffusion-TS code sits underneath it. All stages exchange data only
through Parquet files in data/ and artifacts/. The hypotheses package reads the collected tables
and tests the hypotheses.
What the figure shows
Six layers, from top (how the benchmark is launched) to bottom (statistical analysis):
| Layer | Contents |
|---|---|
| Execution | Three equivalent ways to run: Docker (two images, bench with PyTorch and tsgm with TensorFlow), Colab notebooks (one per stage, 01–07), or local virtual environments from envs/. |
| bench: infra | run.py (stage driver / CLI), config.py (the Config dataclass, profiles min/mid/max, unit fingerprints), registry.py (10 name registries), storage.py/load.py (Parquet I/O; reloading generators and models without retraining), timing.py (wall/CPU time, GPU and RAM peaks). |
| bench: stages | Domain modules in pipeline order: data preparation, tasks/labels, generators, assemblers and seam joiners, method definitions, fidelity metrics, utility (TSTR/TRTR) with its ML models. |
| Libraries | the pinned official Diffusion-TS repository, the zseries assembler (the proprietary assembler of zypl.ai, under development: published results, code not in the repository) and third-party libraries. |
| Storage | data/ (raw and processed series) and artifacts/<profile>/ (all outputs; see Fig. 16). |
| hypotheses | overall.py (overall leaderboard: fidelity on the core metrics and utility), leaderboard.py (ranking of every method in every slice), metric_values.py (values of the core fidelity metrics and the primary utility metrics by reference, dataset, task, model and split), questions.py (research questions RQ0–RQ9, confirmatory family C1–C4), catalog.py (loaders, case study CS1–CS15), engine.py (noise, paired effects, verdicts), stats.py (tests and corrections); output — the reports OVERALL.md, LEADERBOARD.md, METRIC_VALUES.md, REPORT.md in reports/ and the Parquet tables. |
Notes for the text
- Colour coding is shared by all figures: blue = real data and preprocessing, orange = generative models, yellow = assembly, pink = fidelity, green = downstream ML (utility), purple = statistics, grey = infrastructure and storage.
- The benchmark and the analysis are decoupled.
hypothesesreads only the tables and saved predictions; it never trains generators. Subgroups (CS12) and dataset descriptors (RQ7, CS15) also readdata/processed. - Sources:
BENCHMARK.md,marathonts/bench/registry.py.